Cyclistic Bike-share Case Study

Project Overview
The Cyclistic case study focuses on a bike-sharing company that has experienced significant growth since its 2016 launch in Chicago. With a fleet of 5,824 bikes and 692 stations, Cyclistic offers flexible plans that have attracted different types of users: individual or day passes for casual riders, and annual memberships for Cyclistic members. While this flexibility has broadened its customer base, financial analysis shows that annual memberships generate more revenue. In light of this, marketing director Lily Moreno is looking to design specific strategies to convert casual riders into annual members. To achieve this, it is essential to analyze the differences in the behavior of both groups and explore how digital media can influence conversion. This project is based on the analysis of historical travel data to identify patterns and guide marketing decision making.
This capstone project completed the Google Data Analytics Certificate program.
Verify Certification
To view the dashboard in Tableau, please visit the following link .
Key Features
- Sales performance by product category
- Regional sales comparisons
- Seasonal trends analysis
- Customer purchasing patterns
Defining the Problem
The main challenge facing Cyclistic's marketing director, Lily Moreno, along with the analytics team, is to design an effective strategy that motivates occasional users (casual riders) to convert to annual members.
This conversion is key to the company's sustained growth, as annual members represent a more stable and profitable source of revenue. To develop an informed marketing strategy,
it is necessary to understand in depth the behavior of both types of users and the motivations that could drive a category change. In this regard, the project is guided by the following key questions:
- How does the use of Cyclistic bikes differ between annual members and occasional users?
- What factors might motivate occasional users to purchase an annual membership?
- In what ways can Cyclistic use digital media to influence the decision of occasional users and encourage their conversion to membership?
Business Task
Through historical analysis identify usage patterns between annual members and occasional users to design digital marketing strategies to convert occasional users into annual members.
Technologies Used
The following technologies were used to develop this project:
- Python: Used for data cleaning, transformation and analysis. The pandas library was used to facilitate data processing and exploration.
- PostgreSQL: Used to store the structured data and perform efficient SQL queries that allowed the analysis of large volumes of information.
- Tableau: Tool used for data visualization, allowing the generation of interactive graphs and dashboards that facilitate the interpretation of the patterns found.
Database
For this analysis, Cyclistic's historical bicycle trip data corresponding to the last 12 months of the year 2024 will be used. This data has been provided by Motivate International Inc. and is available at this link under this license. For privacy reasons, personally identifiable user information has been removed. The data is stored in compressed files in .CSV format.
-- Monthly Divvy trip data files (2024)
01) 2024-02_divvy_trip-data.csv
02) 2024-03_divvy_trip-data.csv
03) 2024-04_divvy_trip-data.csv
04) 2024-05_divvy_trip-data.csv
05) 2024-06_divvy_trip-data.csv
06) 2024-07_divvy_trip-data.csv
07) 2024-08_divvy_trip-data.csv
08) 2024-09_divvy_trip-data.csv
09) 2024-10_divvy_trip-data.csv
10) 2024-11_divvy_trip-data.csv
11) 2024-12_divvy_trip-data.csv
12) 2024-01_divvy_trip-data.csv
Data Storage
A database was created in PostgreSQL to store the data. After downloading and unzipping the .zip files, the data were loaded into the MONTHLY_TRIPS schema, previously created in the database. A total of 12 tables were generated, one for each file corresponding to the months of the year, with the following configuration:
CREATE TABLE MONTHLY_TRIPS.tripdata_202401(
    ride_id VARCHAR(50) PRIMARY KEY,
    rideable_type VARCHAR(50),
    started_at TIMESTAMP,
    ended_at TIMESTAMP,
    start_station_name VARCHAR(100),
    start_station_id VARCHAR(50),
    end_station_name VARCHAR(100),
    end_station_id VARCHAR(50),
    start_lat NUMERIC,
    start_lng NUMERIC,
    end_lat NUMERIC,
    end_lng NUMERIC,
    member_casual VARCHAR(10)
);
Python Virtual Environment
Once the tables were stored in the database, a virtual environment was configured in Python to carry out the data processing. The project structure was organized as follows:
venv/ # Python virtual environment
config.py # Configuration file with database connection variables
database.py # Functions to connect to and query the database
requirements.txt # List of project dependencies
test_connection.py # Script to verify the database connection
trip_analysis.ipynb # Exploratory trip analysis notebook
- config.py: Configuration file with the database connection variables.
- database.py: Script that defines a Database class to manage the connection to the PostgreSQL database.
It uses the psycopg2 library and gets the connection parameters from the config.py file. The class includes methods for:
- Connect to the database (connect).
- securelyclose the connection (disconnect)
- Check if the connection is active (is_connected)
- Execute SQL queries and return the results (fetch_all).
- test_connection.py: Script to test the database connection and verify that everything is working correctly. This is useful for testing connectivity and ensuring that the configuration parameters in config.py are correct before continuing with data analysis.
- data_manager.py: This script defines the `DataAnalyzer` class, designed to facilitate the analysis and cleaning of data extracted from the database. It uses pandas to manipulate the data in DataFrame format and provides key functionality to prepare the information before analysis.
Its main methods are:
- fetch_data(query): Executes a SQL query via a database connection instance and returns the results in a pandas DataFrame.
- analyze_null_values(df): Displays detailed statistics on null values per column and globally in a DataFrame.
- clean_data(df): Performs cleanup tasks such as replacing null values in station columns with 'Unknown' and removing rows without target coordinates.
- add_time_columns(df): Adds new time-related columns (hour, day of the week, month, year and trip duration in minutes), based on the started_at column.
- trip_analysis.ipynb: This Jupyter notebook is the core of the exploratory analysis of the case study. It integrates queries to the PostgreSQL database and data processing with pandas.
Data Processing
Using the trip_analysis.ipynb notebook, the connection to the tables stored in postgres was established and the contents of the tables were examined table by table.
# Define the SQL query to fetch data for January 2024
query = "select * from MONTHLY_TRIPS.tripdata_202401;"

# get the data for January 2024
df_202401 = analyzer.fetch_data(query)
This table contains the following information:
- The dataset contains 144,873 records and 13 columns, corresponding to trips taken by bicycle by users of the Cyclistic system.
- The variables capture information on the type of bicycle, start and end times of the trip, origin and destination stations, geographic coordinates, and type of user.
- The ride_id, rideable_type, started_at, ended_at and member_casual columns are complete (no null values).
- The start and end stations (names and IDs) contain null values in about 13% to 15% of the records.
- Destination coordinates (end_lat, end_lng) have a small proportion of null values.
- The temporal data are correctly formatted as datetime64[ns], while the rest are of type object.
Null counts per column (descending order):
end_station_name      20749
end_station_id        20749
start_station_id      19165
start_station_name    19165
end_lat                 288
end_lng                 288
started_at                0
rideable_type             0
ride_id                   0
ended_at                  0
start_lat                 0
start_lng                 0
member_casual             0
dtype: int64

Null percentage per column (descending order):
end_station_name      14.32
end_station_id        14.32
start_station_id      13.23
start_station_name    13.23
end_lat                0.20
end_lng                0.20
started_at             0.00
rideable_type          0.00
ride_id                0.00
ended_at               0.00
start_lat              0.00
start_lng              0.00
member_casual          0.00
dtype: float64

Global null value analysis:
- Total cells: 1,883,349
- Total null values: 80,404
- Global null percentage: 4.27%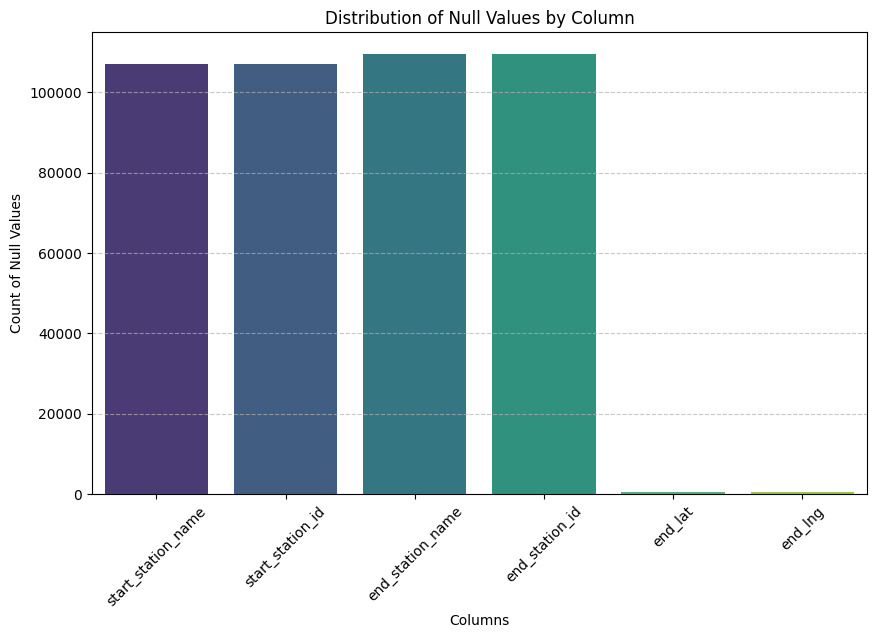
Distribution of null values
Data Cleaning
Given that the proportion of missing data exceeds 10%, discarding these records could result in significant information loss. Thus, the decision was made to preserve the entries and handle null values by assigning them to a dedicated category: "Unknown."
def clean_data(self, df: pd.DataFrame) -> pd.DataFrame:
    """
    Clean the DataFrame:
    - Fill null values in station columns with 'Unknown'
    - Remove rows without destination coordinates

    Args:
    df (pd.DataFrame): DataFrame

    Returns:
    pd.DataFrame: cleaned DataFrame
    """
  stations_column = [
      "start_station_name", "start_station_id",
    "end_station_name", "end_station_id"
    ]
  for col in stations_column :
    df[col] = df[col].fillna("Unknown")

    df = df.dropna(subset=["end_lat", "end_lng"])
    return df
Given that all files display comparable patterns of missing data, a consistent treatment approach was implemented across the dataset.
for month in range(1, 13):
    variable_name = f"df_2024{mes:02}"
    df = globals().get(variable_name )

    if df is not None:
        globals()[variable_name] = analyzer.clean_data(df)
To support data analysis and uncover key patterns for marketing strategy development, the following steps were taken: extraction of day, month, and year from started_at, and computation of trip duration.
# Functio to add new columns to the DataFrame
def add_time_columns(self, df: pd.DataFrame) -> pd.DataFrame:
    """
        Add new columns to the DataFrame based on the 'started_at' column:
            - 'hour': Hour of the trip
            - 'day_of_week': Day of the week of the trip
            - 'month': Month of the trip
            - 'year': Year of the trip
        Args:
            df (pd.DataFrame): DataFrame with a 'started_at' column of datetime type.
        Returns:
            pd.DataFrame: DataFrame with new columns added.
    """
  # get the trop duration in minutes
  df['trip_duration'] = (df['ended_at'] - df['started_at']).dt.total_seconds() / 60  # Trip duration in minutes
  # Get the day of the week for each trip
  df['day_of_week'] = df['started_at'].dt.day_name()
  # Get the month name for each trip
  df['month'] = df['started_at'].dt.month
  # get the year for each trip
  df['year'] = df['started_at'].dt.year

  return df
The function was iteratively applied to all twelve tables using the following implementation:
for i in range(1, 13):
    df_name = f"df_2024{i:02}"
    df = globals().get(df_name)

    if df is not None:
        globals()[df_name] = analyzer.add_time_columns(df)
The relevant variables were then extracted and all datasets were persisted as .csv files for further analysis
# Define the columns to keep in the final DataFrame
columns_to_keep = [
    'ride_id',
    'rideable_type',
    'start_station_name',
    'start_station_id',
    'end_station_name',
    'end_station_id',
    'start_lat',
    'start_lng',
    'end_lat',
    'end_lng',
    'member_casual',
    'day_of_week',
    'month',
    'year',
    'trip_duration'
]

# Store DataFrame in CSV files for each month
for mes in range(1, 13):
    df_name = f'df_2024{mes:02}'
    df = globals()[df_name]  #get the DataFrame from global environment
    df[columns_to_keep].to_csv(f'df_2024{mes:02}.csv', index=False)
The processed .csv files replaced the original datasets and were reorganized into four quarterly tables (Q1: Jan-Mar, Q2: Apr-Jun, Q3: Jul-Sep, Q4: Oct-Dec).
CREATE TABLE tripdata2024.q1_tripdata AS
SELECT
    ride_id,
    rideable_type,
    start_station_name,
    start_station_id,
    end_station_name,
    end_station_id,
    start_lat,
    start_lng,
    end_lat,
    end_lng,
    member_casual,
    day_of_week,
    month,
    year,
    trip_duration AS ride_length,
    'Q1' AS quarter
FROM tripdata2024.data202401
UNION DISTINCT
SELECT
    ride_id,
    rideable_type,
    start_station_name,
    start_station_id,
    end_station_name,
    end_station_id,
    start_lat,
    start_lng,
    end_lat,
    end_lng,
    member_casual,
    day_of_week,
    month,
    year,
    trip_duration AS ride_length,
    'Q1' AS quarter
FROM tripdata2024.data202402
UNION DISTINCT
SELECT
    ride_id,
    trip_duration AS ride_length,
    rideable_type,
    start_station_name,
    start_station_id,
    end_station_name,
    end_station_id,
    start_lat,
    start_lng,
    end_lat,
    end_lng,
    member_casual,
    day_of_week,
    month,
    year,
    'Q1' AS quarter
FROM tripdata2024.data202403;
Data Analytics: Exploratory Analysis
Total Users
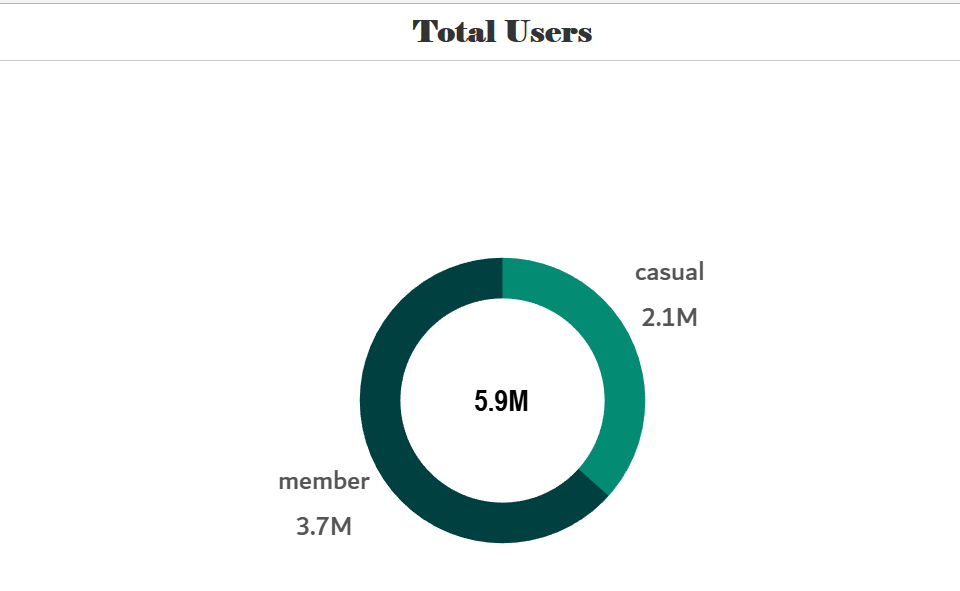
The company reported a total of 5.9 million users, of which 3.7 million are current members and 2.1 million are casual users.
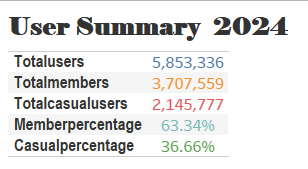
That is, 63.34% are annual members and 36.66% are occasional users.
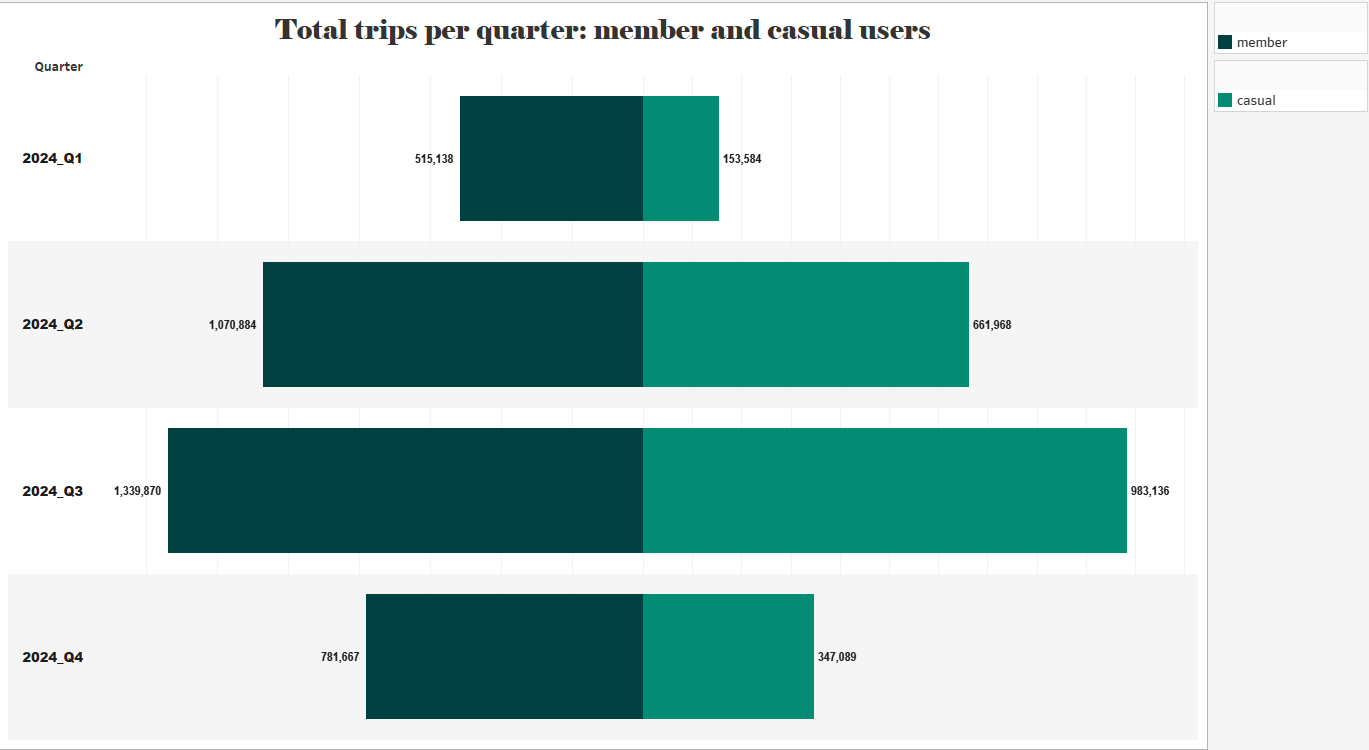
Total Trips per Quarter
The total number of trips made by users was recorded on a quarterly basis. It was found that the number of trips increases significantly during the spring and summer quarters (Q2 and Q3) and decreases in the winter quarters (Q1 and Q4)—a typical trend in micromobility services due to seasonal factors. The third quarter (July–September) showed the highest activity, reaching a peak of:
- 1,339,870 trips by members
- 983,136 trips by casual users
- In contrast, the first quarter (January–March) recorded the lowest number of trips:
- 515,138 by members
- 153,584 by casual users
- User Type Distribution Summary
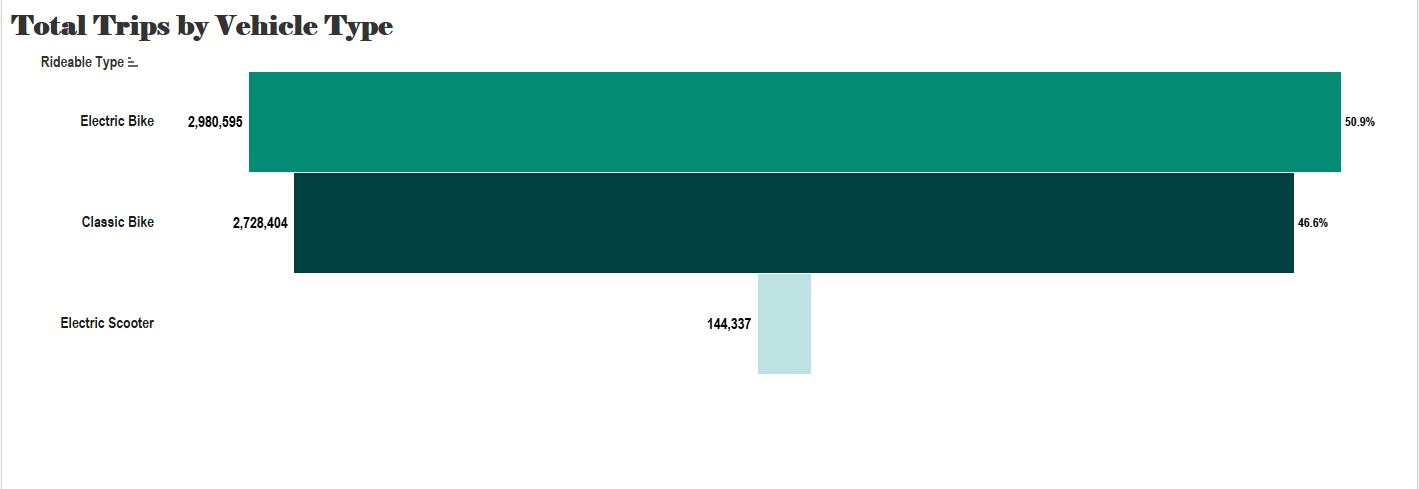
Total Trips by Vehicle Type
The total number of trips by vehicle type was recorded. It was reported that 50.9% of users tend to use electric bikes, while 46.6% used classic bikes, and the remaining percentage chose to use electric scooters.
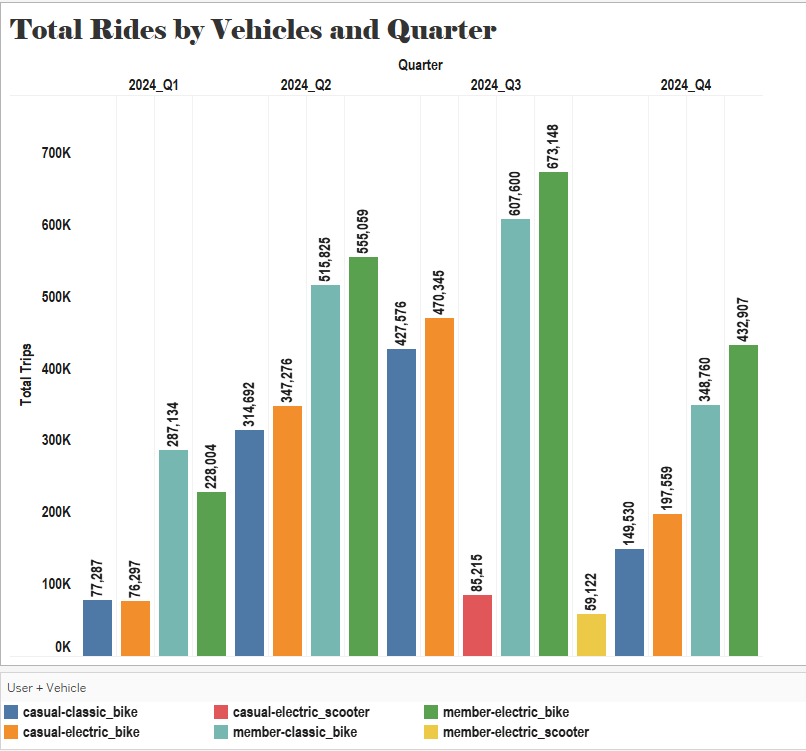
Total Trips per Quarter in 2024, Segmented by User Type and Vehicle Type
An analysis was conducted on the total number of trips made during each quarter of 2024, segmented by user type (member and casual) and vehicle type. It was found that the first quarter (Q1) showed low activity. Members favored both classic and electric bikes, with a higher proportion of trips on classic bikes. In contrast, casual users had lower participation overall but showed a balanced usage between classic and electric bikes. During the second quarter (Q2), a notable increase in the use of all vehicle types was recorded. Electric bikes experienced a significant surge, leading in both trip volume and user preference. The third quarter (Q3) marked the highest usage across all segments, with electric bikes being the most frequently used. Additionally, electric scooters were recorded for both user types, with greater usage among casual users. In the fourth and final quarter (Q4), there was a significant decline in trip volume. Nevertheless, electric bikes remained the most commonly used vehicle type for both members and casual users.
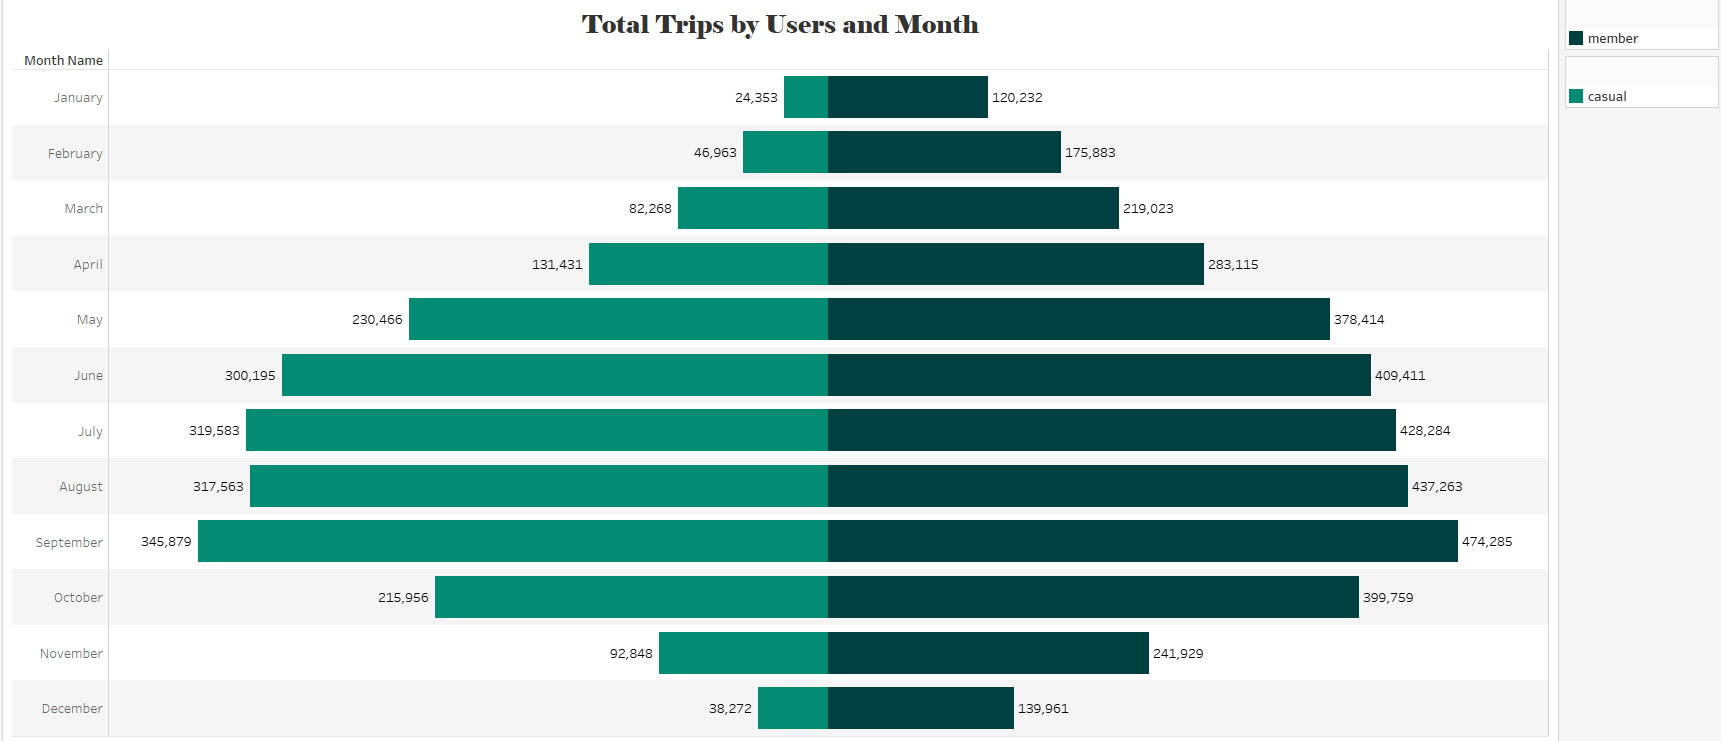
Total Trips by Month and User Type
An analysis of the total number of trips by user type on a monthly basis reveals the following:
- Overall, annual members tend to use the micromobility service more frequently than casual users.
- During the first four months (January–April), activity levels are relatively low.
- From May to October, there is a significant increase in usage for both user types, with September marking the highest level of activity.
- Finally, in the last two months (November–December), trip volume decreases again, although the service continues to be used more frequently by annual members.
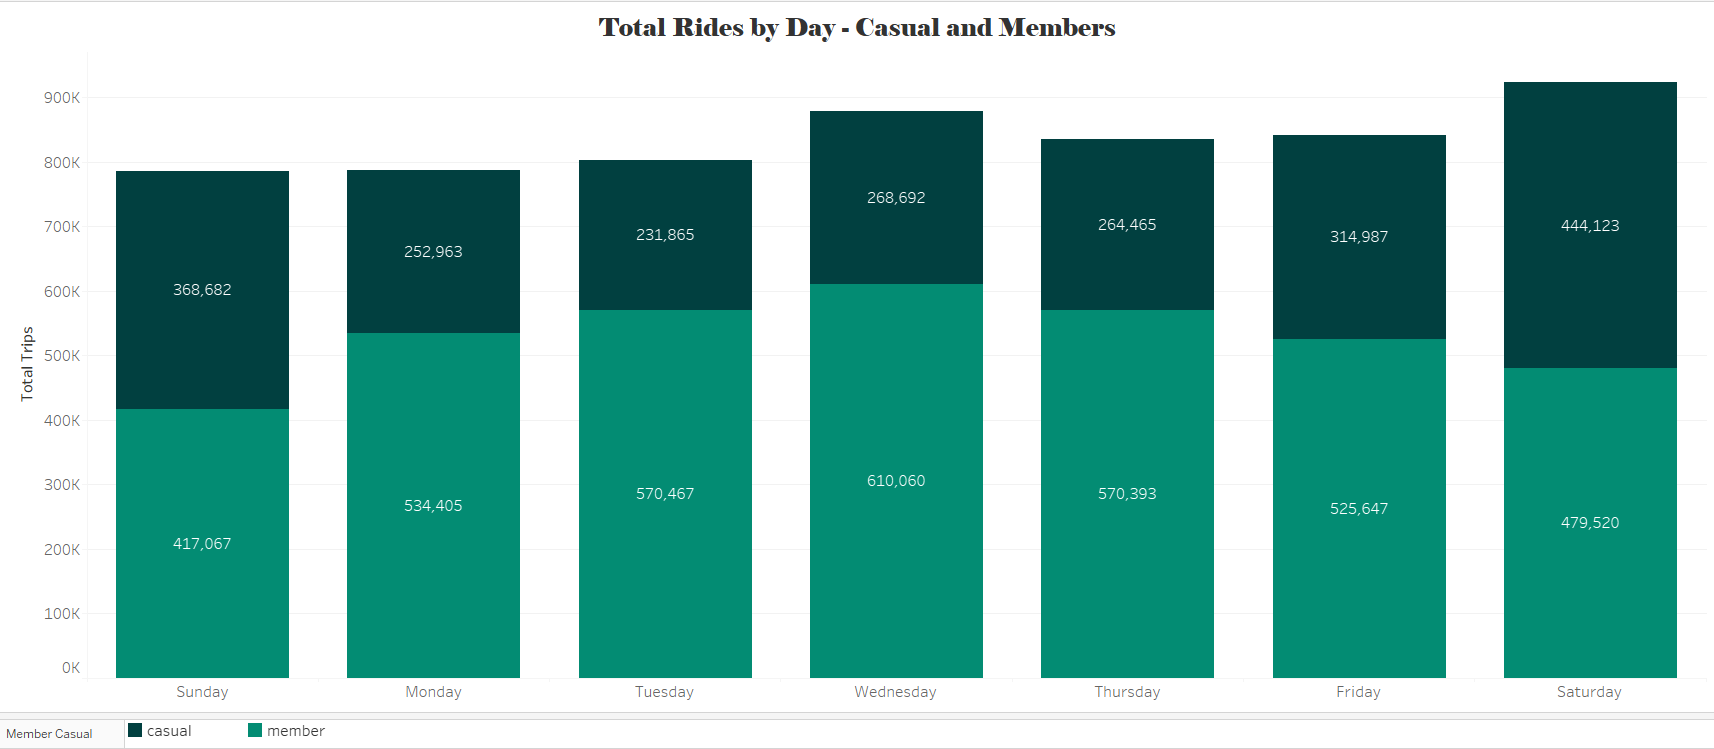
Total Trips by Day – Member and Casual Users
The total number of daily trips was recorded and segmented by user type. Sundays show a balanced distribution between both groups, with a slight majority of trips made by annual members (417,067) compared to casual users (368,682). On Mondays, Tuesdays, and Wednesdays, there is a higher level of activity among members. In contrast, on Thursdays, Fridays, and Saturdays, member activity tends to decline while trips by casual users increase, reflecting a shift in usage patterns depending on the day of the week.
Strategic Recommendation
Member users
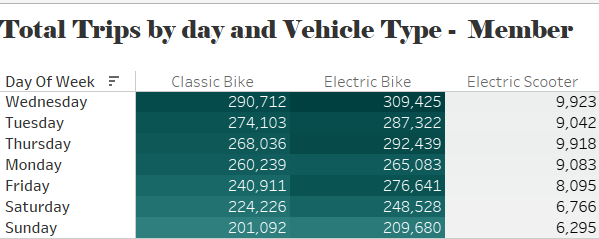
For member users, Wednesday stands out as the day with the highest volume of trips, particularly with electric (309,425) and classic bikes (290,712). Although electric scooters show significantly lower usage overall, they reach a modest peak on Wednesday (9,923). Electric bikes consistently outperform classic bikes throughout the week. The lowest levels of activity among members occur on Saturdays and Sundays, indicating a usage pattern primarily linked to weekday commuting.
Casual Users
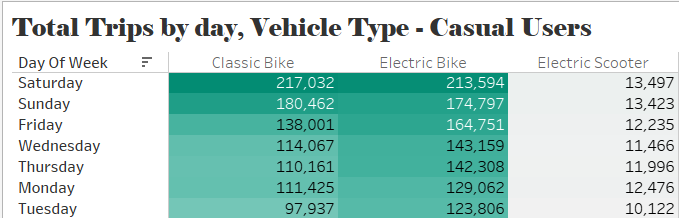
For casual users, Saturday records the highest number of trips, with a balanced usage of electric bikes (271,032) and classic bikes (213,594). Although electric scooter usage is significantly lower, it maintains a consistent presence throughout the week. Electric bikes slightly outperform classic bikes every day. The lowest activity is observed on Mondays, Tuesdays, and Wednesdays, suggesting that casual users primarily use the service for recreational purposes on weekends and non-working days.
Strategic Recommendation
Based on the analysis conducted, the following key insights were identified:
- Casual users tend to use the service more frequently on weekends, especially on Saturdays, mainly for recreational purposes.
- They show a slight preference for electric bikes over classic bikes.
- Their weekday activity is low, in contrast to annual members, who primarily use the service from Monday to Wednesday, likely for commuting or routine mobility.
Recommended Strategy
Design targeted campaigns that highlight the value of frequent use, aimed at encouraging casual users to convert into annual members. Suggested actions include:
- Weekend-specific promotions, such as:
- Free trial memberships valid for a weekend.
- Discounts for users who complete more than “X” rides in a month.
- Educational campaigns via social media and the app to communicate:
- The cost savings of a membership versus single-ride passes.
- Exclusive benefits like early access to events or preferred docking at high-demand stations
- Personalized in-app messaging:
- When recreational usage patterns are detected, suggest that an annual membership allows weekday use at no extra cost.
- Recommend “popular” destinations or routes often used by members.
- Enhancing perceived value:
- Share testimonials from users who started as casual riders and became satisfied members.
- Associate the membership with an active lifestyle and a sense of community.
- Strategic partnerships:
- Collaborate with gyms, coffee shops, or cultural centers to offer additional perks to members.